
Infographics are our favourite topic, they can be really amazing when you have a well-developed concept. We already wrote about process of designing an infographic, and you can read about it here. In this article we will only take one’s cue from already mentioned and expand knowledge on infographics.
Information graphics or infographics are a visual presentation of information, data or knowledge. You can use these graphics to all those annoying, less interesting information and numbers transfer to the reader / viewer in a visual more interesting way.
People like creative and precise infographics, they are getting a lot of attention now, as in the times when people were limited mainly to newspapers and magazines. In the digital world, there is a lot more information and even more interesting ways to visualize them. Robust animated graphics, interactive 3D animations, just think of the world of video games. The combination of amazing graphics, and all collected information through communication activities is the future. And so many things are yet to come.
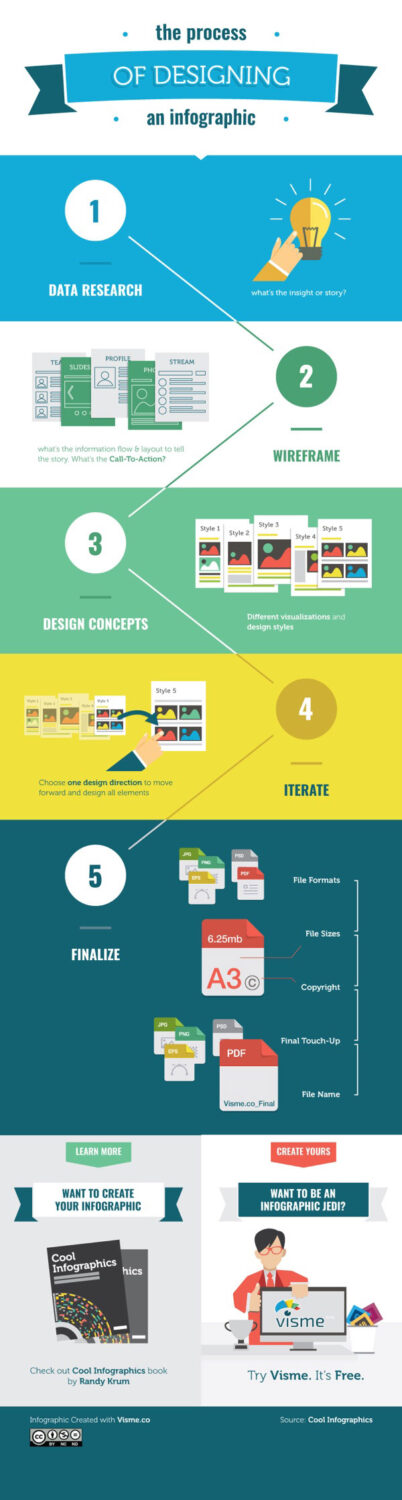
How to make the infographic in 5 steps / stages:
- Answer the question, what I want to achieve?
- The analysis, research and data collection
- Deduction
- Data Visualization
- Design infographics
If you want to learn how to create infographic, check one of our previous article. Below is infographic about the process of designing an infographics:


")


