As you may have noticed, we write a lot about infographics because they are so great. But, do you know how and when they occurred and from where they come from? In this article we will say something about the history of infographics, and also attach infographic related to that topic.
During prehistory, our early ancestors created the first informational graphics: pictures inside the caves, and later on the map. The beginnings of maps dating from much earlier records, known example is map Çatalhöyük from 7500 BC. Later people began to use symbols to mark cattle and stock. Natives from Central America were depicting travels of past generations with various images. These images today are for us very imaginative, and it’s thought that this have been used for the purpose of recounting and remembering events.
1626 Christopher Scheiner published “Rosa Ursina sive Sol” in which were a variety of graphics of astronomical research of the sun. Scheiner used a variety of series of images to explain the rotation of the sun.
1786, William Playfair published the first data graphs in his book “The Commercial and Political Atlas”. The book is full of statistics showing the economy of England of the 18th century using various schemes and histograms. James Joseph Sylvester introduced the term “graph” in 1878 and published a series of diagrams showing the relationships between chemical bonds and mathematical laws. These were the first mathematical graphs.
1936 Otto Neurath introduced a system of pictographs which were intended to function as an international visual language. In 1972 at the Olympics in Munich, Otl Aicher introduced a number of new pictograms that have proved extremely successful and ubiquitous “stick figures” began to be used more on public signs.
Also in 1972 was launched the Pioneer 10 probe with “Pioneer Plaque”. The plaques were drawings of information graphics, which is a kind of interstellar message in a bottle, designed by Carl Sagan and Frank Drake. The message is unique and it is intended to be understood by extraterrestrial beings who do not share a common language with people. It displays an image of man and woman standing in front of the simplified silhouette of the probe, in order to give a sense of scale.
Today we are surrounded by information graphics in the media, in published works, both literary and scientific, in road traffic and the manuals of all kinds. Graphics constitute information that would otherwise be very hard to grasp just as text. It’s a visual shortcut to everyday actions and events. The press information graphics usually are weather, maps, city maps, plans events and statistics.
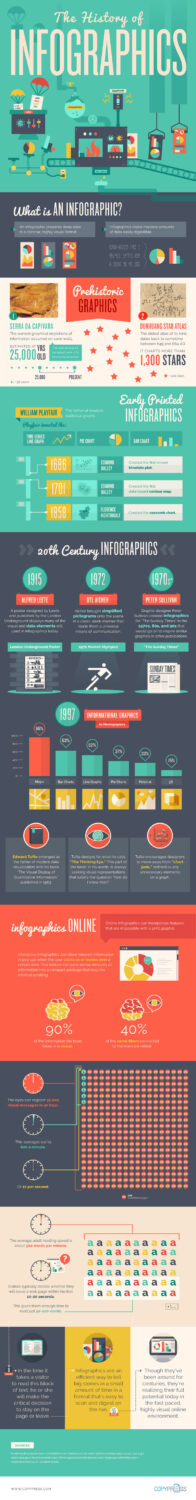
The world is unthinkable without information graphics. It surrounds us in all aspects of our areas of activity. Exceptionally helps to very complex issues, but also everyday situations present in simple and concise manner understandable to everyone using the visual language. Below you can check infographic about the history of infographics: