
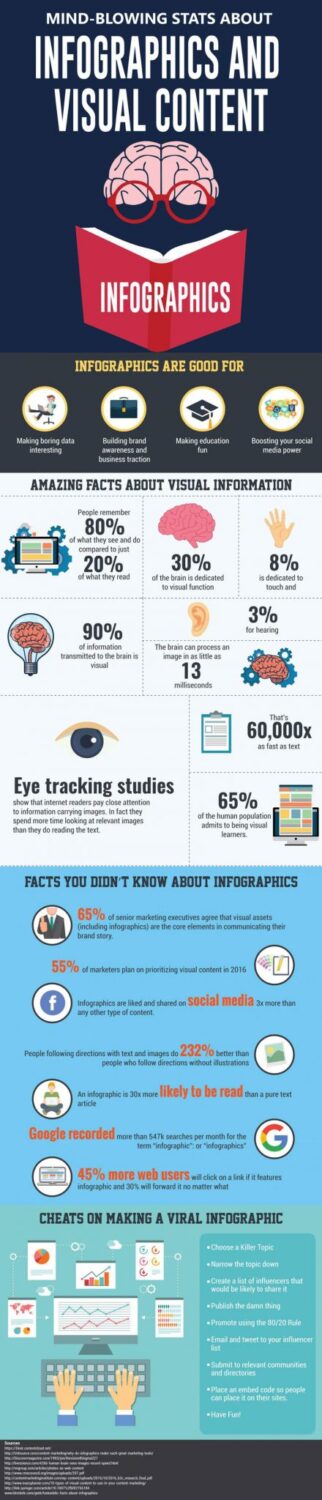
Infographics are super effective tools and people are looking for them like crazy. In the last 2 years, in terms of searches there was astounding 800% increase for them. So why are infographics important that much? There was an interesting study done by Wharton School of Business. Audience was shown 2 presentations, one of them had visual imagery and the other did not. 67% of audience was more affected by first presentation, compared to the other one which affected 50% of audience. People are 30 times more likely to read infographics then just article with lots of text. When people read something they only remember 20% of it, compared with 80% of what they do and see. Did you knew that in one day people create almost 2 billion content pieces, 150 million tweets and over 2 million videos. There are oceans and mountains of data and people attempt to curate and organize information. But what are infographics exactly? Infograhics are effective way of mixing images, text and design so you can present data in a way that tells story.
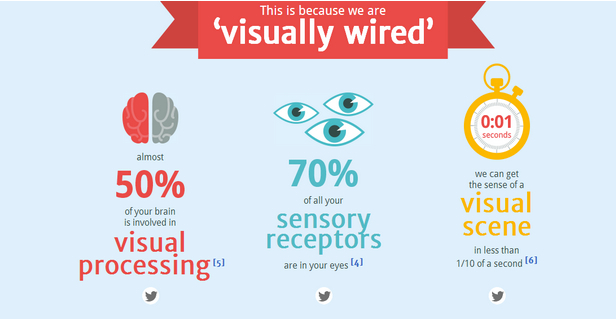
Our brain is processing images 60000 times faster then reading text. When you combine both graphic and text it allows you to take advantage of both of them. So why use infographics in marketing strategy at all? They sure look attractive and compelling. People are highly visual human beings, and almost 90% of information has to be tapped into optic nerve. Infographics can easily be shared on social media platforms then any ordinary content with just text. Infographics are effective in creating awareness of company’s brand, especially if it’s embedded with the logo. If you create infographic that is compelling by nature it will drive traffic to your webpage as people will click on it and share too.
Just like infographics are having impact on your business, so does visual content too. It boosts sales, engagement and reaching of the customers. Visual content is so important as we see it on almost across every social platform including Twitter, Instagram, Facebook and Pinterest. Did you know that people are more likely to read content if it has colored visuals? Almost 80% of willingness is increased then. If people just hear piece of information when someone is giving them presentation, they will remember only 10% of it for 3 days later, but if presenter pairs up text with some effective images, 3 days later they will remember 65% of same information.
Study has shown that almost 50% of people in marketing field said that photography is one of crucial elements for their storytelling strategies. 40% of marketers are thinking that that they should allocate their budget to create more effective visual content. 70% of people who are doing online marketing are using visual content in their marketing on social network platforms. So, how do you plan to include visual content and infographics to your marketing strategy?


")


