
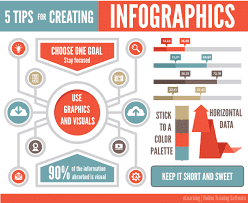
Infographics tools have risen in popularity recently, and even more, the online tools have become inexpensive making anyone able to create them. Images build a lot of engagement compared to using only text posts, and in fact, infographics can help you build links that boost your traffic. People appreciate the information that they can be able to consume easily and quickly that is why infographics are appropriate.
There are 5 infographics tools that would be helpful when building your infographics. Please read below to find out more about the beauty and power of creating one.
Spreadsheet
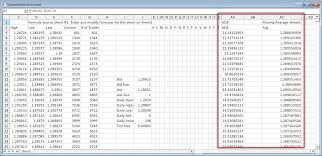
You may have a company that does study or survey, which involves a lot of information and data gathering. Using a basic Excel or Google spreadsheet will you organize all your facts and figures that should be helpful to your company to allow you keep track of data sources. The sources list are the ones that add credibility to your infographic. Also, creating a spreadsheet is useful because it creates more data points than needed. The foundation of your infographic is data, thus, it is not wise to skip the step and head to the design if you need to provide real value.
Pen and Paper

You might have huge data amounts but have no direction to create an infographic even though an online template is available as a design tool. Using a pen and paper is important in planning out your infographic before making it. Instead of drawing every single graph, you should outline the necessary information in your infographic flow. Some may feel as an unnecessary extra step but drafting your infographic enables you to get people’s feedback. It also helps you to make a inexpensive visualization. Thus, if you do not like the initial idea, make the changes and move to the next step effortlessly.
Infogr.Am (Best Free Design Tool)
Infogr.am is one of the FREE infographics tools out there that has 6 templates available in its pack. The design options allow interactive charts and a huge media variety that enable you to easily insert into these infographics. 31 diverse graphs maps, videos, text blocks are available to select from and permits pictures uploading. The feature enables data directly from Excel charts files and allows easy layout change through dragging. Although Infogr.am’s designs are usually attractive and simple, it doesn’t leave enough room to customize the infographic look.
Piktochart (One of the best paid infographics tools)
Piktochart is described by many as a top choice when it comes to an economical infographic design tool. It differs from Infogr.am in that it allows you to take complete control your design aspect. It allows you to choose your background color, shapes, font, graphs, icons, and size on the page.
The free version enables you to choose from 7 different themes, icons and images, alongside pictures upload ability to upload. While, the paid version ($29 monthly) enables you to access 108 different themes. Piktochart’s themes are easily customizable, so one should say that you should personalize your infographics maximally. However, it doesn’t have a handy layers toolbar like that one of Photoshop.
TimelineJS
Through TimelineJS one can generate interactive timelines such as maps, quotes, photos, videos, and tweets hat displays the company’s business. So long as the required media is available online, timeline making process is pretty simple. TimelineJS enables you to fill in dates, headlines, links, text, and media in a Google Docs spreadsheet. Aside from varying the font type, TimelineJS doesn’t provide numerous opportunities to customize your timeline look. Timelines is a unique way that you can share and visualize data using infographics and all this could be achieved with the infographics tools.


")


