
In this article we’ll introduce you free online tools for creating infographics. Create your own infographic. Try these tools to display business data on all interesting and understandable way. People love to learn and explore using pictures and charts. Studies have shown that the average person remembers only 10% of information that is heard, while the content that see, through a combination of words and graphics, remember up to 50%. But how to create infographic? It’s actually easier than you think. Try some of the most popular free online tools, except that it will save you time, in their free versions they offer a large number of professionally designed themes.
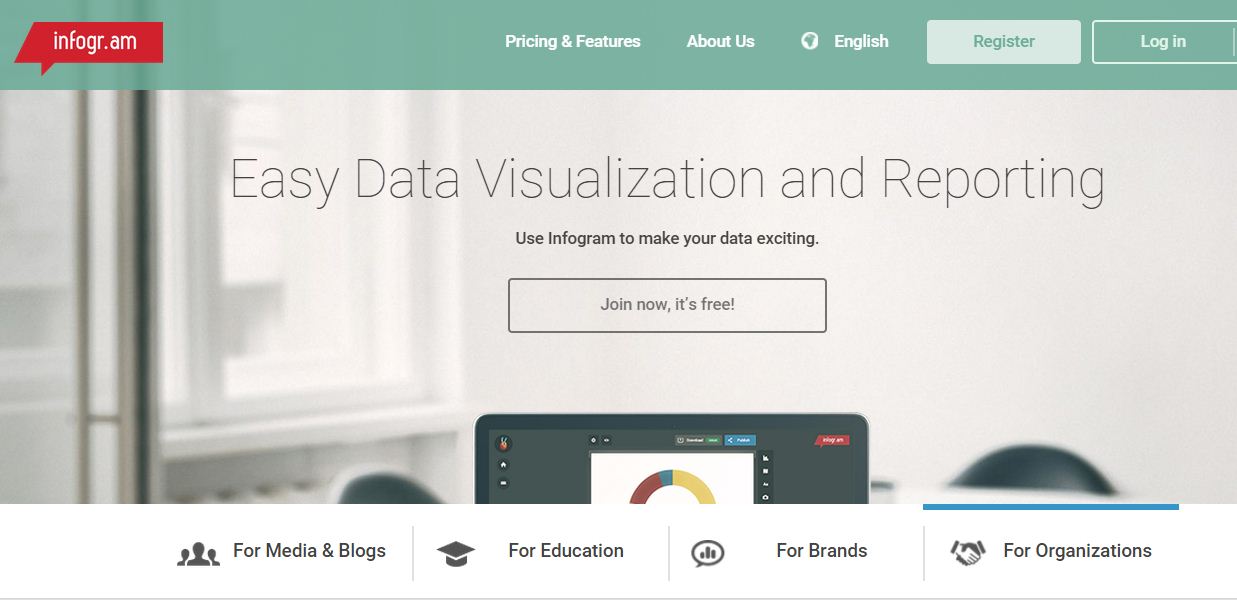
Infogr.am – free tool for creating static and interactive infographics, it contains more than 30 different, professionally designed templates. and its popularity among users justifies the figure of more than 800,000 created infographics. Simply upload your data and Infogr.am will convert your data into interesting graphs and infographics in just a few minutes.
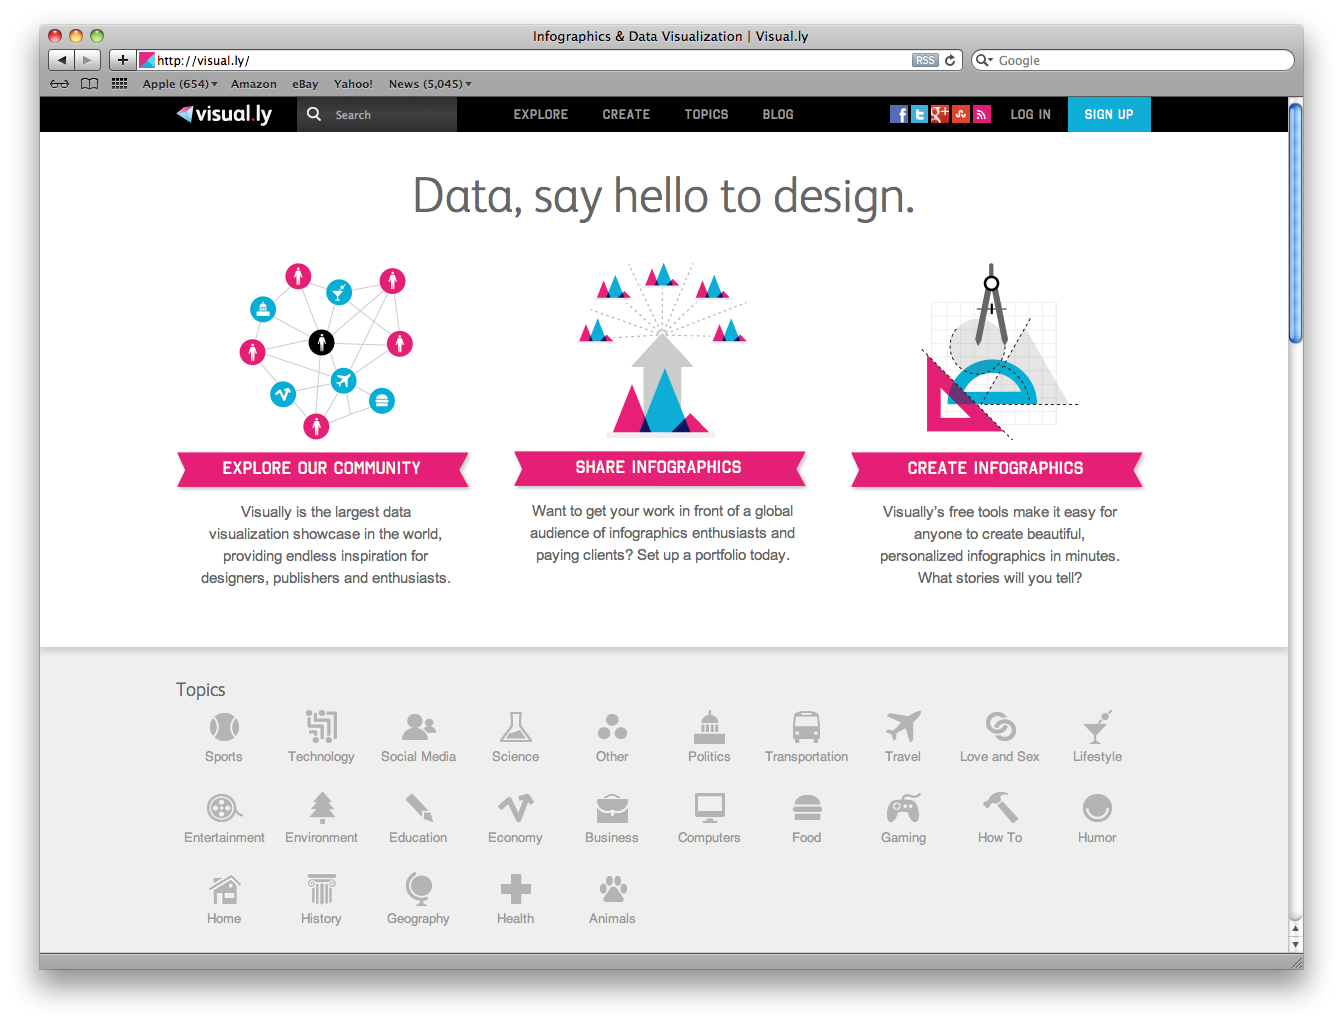
Visual.ly – also one of the most popular tool for creating infographics. In addition it offers a simple set of tools for creating and sharing infographics, you have the option to view infographics by other users, and if you need professional help of designers, ask for help and creating infographics from a designer in the database (this service is payable).
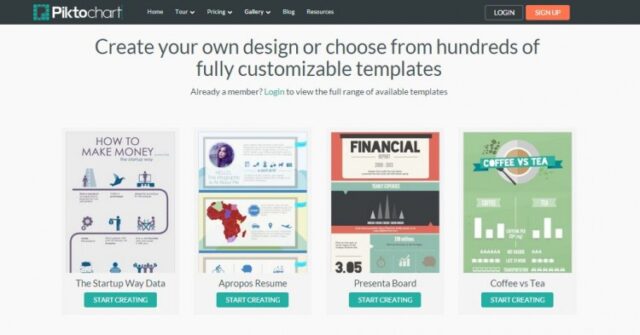
Piktochart – tool for creating infographics using a combination of different types of visualizations: themes, icons, vectors and images. You can export infographic as a image or HTML for quick and easy installation on your website.
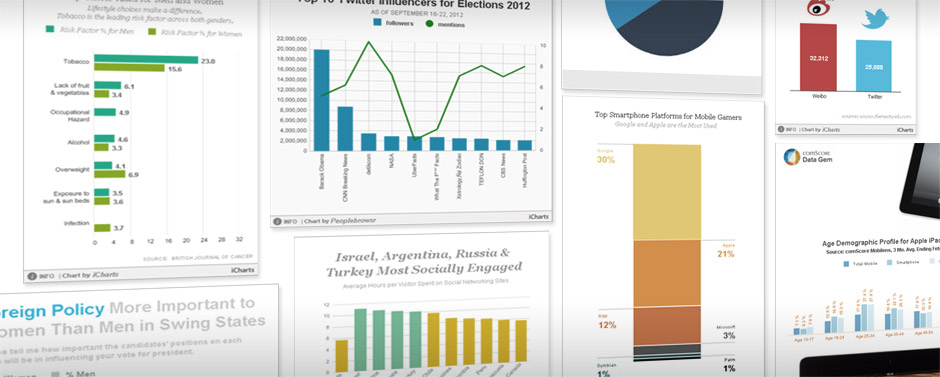
ICharts – helps to create graphs from the data that is interactive and easy to share. Ideal for visualization, sharing and distribution of those little annoying data from Excel spreadsheets or Google Drive.
Google Charts – another free solution that offers database templates ready for use (simple graphics, maps or timelines), and offers also generating a cursor, QR codes, and upload directly to your website.
Timeline – allows grouping of content from various sources in the timeline that is simple and intuitive to use.


")


