
Data literacy and data visualization tools are necessary skills for any online business. Some online design tools provide free trials for visitors on their sites. Others, offer better visualization capabilities at discounted prices. These online tools improve data literacy among several users, be it businesses, students, educators and online marketers. More interesting, one can access such online tools across all platform: Mac, Linux or Windows.
Kinds of online data visualization tools you require
Several infographics and online data visualization tools are around the web. So, it is your choice to choose your favorite. But, the most popular today are:
Visme
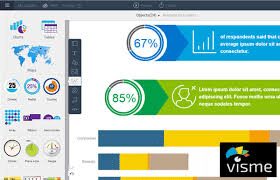
It is one of the data visualization tools you might want to check out.It is a useful online tool that packages your ideas in a various form such as presentations, infographics, reports, among others. Visme’s easy-to-use editor is a built-in charting tool that permits you to easily transform data into visual content. It specifically arrays millions of free images, thousands of quality icons and hundreds of fonts for use in designs. Later on, it enables you to share designs online via a direct link, download offline, posts on social media, or embed on a website.
Infogr.am
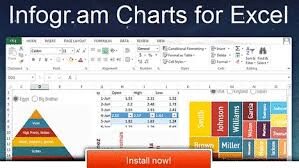
Infogr.am displays your data in the best look and mode easily. Users do not require any coding skills to generate interactive graphics and charts. You are free to connect your chart to live source such as Google Sheets JSON feed or Dropbox file.
Piktochart
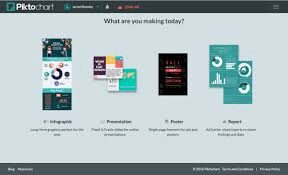
Piktochart one of those data visualization tools that takes whatever visual communication you have to the next level. This easy-to-use infographic maker generates charts through importing data from a Google spreadsheet or a Microsoft Excel file. It offers an array of professionally-designed templates, creates reports, posters presentations and infographics.
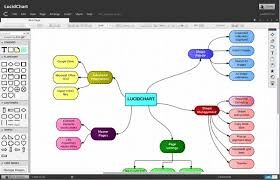
Creately
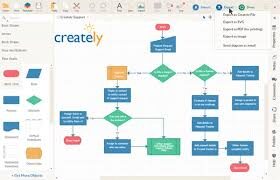
Creately minimizes greatly the time for generating your beautiful diagrams. It entails Venn Diagrams, Flow charts, Gantt charts, mind maps, network diagrams, organization charts, and much more. Over 40 diagrams types and nearly thousands of custom-made subject-specific templates in form of specialized shape sets that are available to improve the beauty of your diagram.
Venngage
Venngage is one of the fines data visualization tools among the online tools that permits users to generate relevant infographics. It incorporates just three simple steps: one chooses a template, adds charts and visuals, and finally customizes the design. Surely, in minutes you can come up with a visual story that may be in social media posts, infographics and posters forms. Then afterward, you can post the generated designs on social media, download simply as a PDF/image file or embed on websites.
Prezi

Prezi is another friendly and great tool for generating engaging and presentations that are memorable. It utilizes editable images, embedded videos and its charting tool. It has a library of templates, as a starting point to give your presentations value whether online or offline. Unique and easy-to-use open canvas build these
Plot.ly
Plot.ly is an advanced higher-level data visualization platform that is mostly used by data scientists and analytics experts. It enables them to generate informative graphics through an online chart creation tool and an open-source visualization library. Using Plotly, import data can easily be imported, create charts created, share findings create presentations through embedding in the dashboards. Specifically, you can use tools and APIs to create technical visuals for MATLAB, D3.js, R, Excel, Python, amongst others.


")


